New set of Sparklines UDF

Sparklines v3.2.2 is available on Sourceforge.

This new version can be used as a stand alone workbook(*.xls) or as a permanent Excel add-in (*.xla).

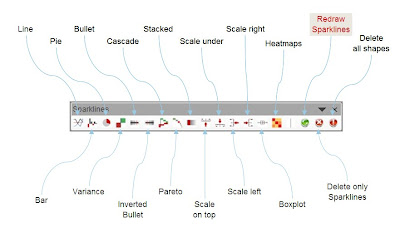
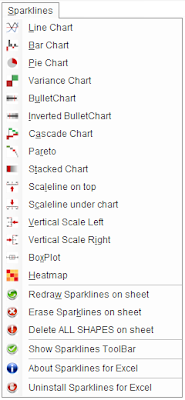
Creation of sparklines is made available through a menu and a toolbar, or by typing the function directly in a cell.


Get a copy of the file here . last Version 3.2 for Excel 2003 - October 24th 2008

Several versions are available for download :

To insert a Sparkline, use the Sparkline Menu or Toolbar.
Fill the function argumentsin the Function Wizard.



Some Sparklines do not display properly when first created with the Function Wizard.
Just update them with the "Redraw Sparklines" option of the menu or toolbar.


Please give me some feedback, share
your ideas and I will do my best to improve the functions.


Heatmaps

It is now possible to create arrays of PieCharts, of variable sizes and colors, through the Heatmap() function.

In addition to the disc position in the array, 3 variables are displayed :
  • Color scale
  • Size variation
  • Size of the slice
Obviously I do not recommend using it for large arrays, but I believe that it works pretty well up to 5 x 5 arrays and 4 colors.


Versions log

Sparklines v 3.2

New Features
  • Possibility to install as an add-in for Excel. Take care if you want to distribute files created with the add-in, the Sparklines function will not work on other users' PC.
  • Menu and Toolbar - All functions can be accessed via those 2 means
  • Vertical ScaleLine - Display a a vertical measure scale next to Linecharts, BarCharts or Heatmaps. Choose left or right size.

Minor Changes

  • Heatmap - now includes the possibility to create arrays of piecharts, with variable size and colors
  • LineChart - Corrected error handling of min and max values
  • StackedChart - Reviewed the display of legend, in order to fit in segments
  • Pareto- Reviewed the display of legend
-----------------------------------------------------------------------------------------

Sparklines v 3.0
  • All charts - added possibility to embed intermediary formulas inside the UDFs)
  • All charts - Each Sparklines is properly renamed (Type, active sheet and position)
  • PieChart - New type of chart Heatmap - New type of chart, suitable for 2D and 3D heatmaps (Size + Color)
  • Boxplot - New type of chart
  • BarChart Added one new parameter (color) to choose the color of the bars
  • LineChart - Added parameters for colors of lines
  • BulletChart - Added possibility to choose a color scheme
  • ScaleLine - Added 3 text zone (Left ; center ; right) and choice of font size
  • VariChart - Added possibility to choose a color scheme
  • Color Scales pdf file- 2 separate sheets with well balanced color scales.
  • Macro to delete Sparklines on the active sheet, but Sparklines only.


Scaleline() specifications


ScaleLine and InvScaleLine now have 3 zones for text + the possibility to change the text size (default=6)


Pareto() specifications


Pareto() sparklines are really meaningful when stacked like here.


BulletChart() and RevBulletChart() specifications

BulletCharts colors can be modified via additional parameter "ColorScheme"


For metrics like "cost" or "claims", where a high value represents a poor performance, use RevBulletChart().


LineChart() specifications

Lines color can be customized, using additional parameters "ColorLine1" and "ColorLine2"


Barchart() specifications