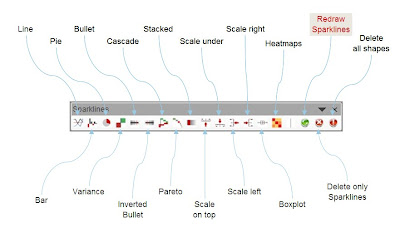
This new version can be used as a stand alone workbook(*.xls) or as a permanent Excel add-in (*.xla).
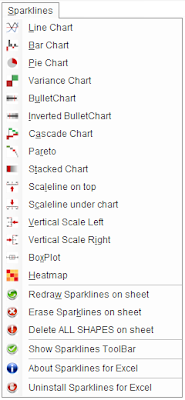
Creation of sparklines is made available through a menu and a toolbar, or by typing the function directly in a cell.


Get a copy of the file here .
Several versions are available for download :
- Version 3.2.2 the last one for XL 2003 only . CAN BE INSTALLED AS AN ADD-IN.
- For Excel 2007 users, use the Template file (no interactive examples)
- Version 2.3.1 Mac, tested on Excel 2004 for Apple Mac.
To insert a Sparkline, use the Sparkline Menu or Toolbar.
Fill the function argumentsin the Function Wizard.

Some Sparklines do not display properly when first created with the Function Wizard.
Just update them with the "Redraw Sparklines" option of the menu or toolbar.
Please give me some feedback, share your ideas and I will do my best to improve the functions.

28 comments:
Excellent! Thanks for sharing your work. I agree that the current implementation of the UDFs is more robust. The UDFs are now more usable.
In my own version of linechart, I added a small dot to mark the minimum value and a blue one for the maximum.
Cheers.
Thanks so much for developing this!
It works most of the time, but I do frequently get "type mismatch" and "overflow" errors.
The cause of errors doesn't seem to be consistent; lines will plot sometimes, but then will fail to plot in another worksheet using the appropriately adjusted formula, i.e. "
=LineChart('otherworksheet' A1:A12,'otherworksheet'B1,'otherworksheet'B2,'otherworksheet'B3)
".
Very confusing! Thanks for your help if you have any ideas.
Great job! The UDF are much more stable now!!!
How can I get the an implementation of linechart that shows the minimum and maximum points?!
Thanks.
Hi,
Looks very good!
I have a problem though:
I imported all Modules, Class modules in my own workbook.
I copied and pasted your code from "ThisWorkbook"
I have Analysis tool pack
I can't import your references, are they neccessary?
The problem is that when I use a function no sparkline appears......
Thanks
Govert
Hi Govi,
do the opposite : copy your modules and worksheets in my workbook and delete my worksheets
I will post a tutorial for the ones who still want to copy the code into their workbooks.
Hi. Amazing product, use it all the time. Only thing I'd add is functionality to add numbers to bullet graphs.
Cheers.
I am trying to use your spraklines in your workbook using analysis toolpak and excel 2003. I have copied my datatables and sheets into your template and when I try to use any function it will not show the sparkline. i can minpulate your originals and they will change but to start a new one it is not displaying anything
Hi Fabrice,
I have the same problem as Jay.
You're sparklines look so good, I really want them to work.........
govi
i had a similar problem. this was because I was copying/moving worksheets from A (my workbook) to B (the workbook with the add in).
I solved it by inserting a new worksheet in B and copying the data from A to B in this new worksheet instead.
hopw this will help
Hi
AS the Analysis Toolpak seems to be the cause of some issues, I posted a version that does not require it (no =randbetween() formula).
Let me know if it works ok now.
Cheers
To activate the references that are shown, you need to go to the 'Tools > References' menu at the top in the Visual Basic Editor. In here, just click funcres and aptvbaen.xls, then 'OK', and you're all done.
Fabrice, I did notice one thing in your code, the inclusion of a chart type function called WindChart, but no corresponding Class. Is this a future chart type or linked to some other code in there somewhere?
For anyone who wants to know how to set transparent backgrounds on the bullet charts, change default colours or turn them into a stacked bar chart, just mail me and I'll post here.
Hi,
it is really amazing! Unfortunately I am not able to make it working - it will always crash. I am using Excel 2000 and the newest version of sparklines (without analysis toolpack). Sometimes it works for couple of minutes but it always ends up with excel crash - no errors, just Dr. Watson.
Do you have any suggestions?
Tomas,
I have created this on excel 2003 and have no report on unstability issues. Some are using it on XL 2007 with minor issues that have been solved (new version posted during week 39-40).
Regarding XL2000, I am surprised as the code does not include any sophisticated instructions.
The only thing I can think about is memory availability on your system or circular formulas that might interfere with the drawing process.
I would recommend a more radical approach... install XL2003 or reinstall your version of XL.
Regards
PS ; please send me e-mails regarding those issues instead of posting here, it will be easier to answer specifically.
fabrice's sparklines is just the best... Thanks for sharing it with us and for your availability with regards to the requests / feedback!
alexandre l.
Help Please !!!
I've attempted to change the legend values in the stacked chart to percentages instead of the original numbers. I have managed to 1/2 complete it, but the problem is that the percentages are put into the opposite box e.g.
Stacked chart with two boxes. The first box should be 20% and the second 80%. But, it shows 80% in the first small box, and 20% in the large second box.
This is my code:
.TextFrame.Characters.Text = Round((((Maximum - Points.Cells(i).Value) / Maximum) * 100), 2) & "%"
Everything else in the code has been left untouched.
Can anyone help please???
Thanks,
Matt
I managed to get the stacked chart percentage amendment to work. The calculations are a bit longwinded but it's better than nothing:
.TextFrame.Characters.Text = Round((100 + ((Points.Cells(i).Value - Maximum) / Maximum) * 100), 2) & "%"
Matt
If max is 100% and the value to be displayed is 20%, your formula is doing 100%-20%=80%... no surprise it shows 80%
Solution !
.TextFrame.Characters.Text = Round(((( Points.Cells(i).Value) / Maximum) * 100), 2) & "%"
I should create a link to the SourceForge Forum for those questions.
Salut !
Hi,
thanks for this great sparkline package with opencode.
only one remark for future versions is following:
in the icons sheet, heatmapicon name "Heatmapicon". but in the vba code, it's HeatmapIcon". it shows error, when i run the xla. i could manually correct error by changing icon name to "HeatmapIcon" in Icons sheet.
can you correct in your package also?
thanks,
Biray
Thank you very much for sharing your excellent work! Thomas
Wow, this is so great! I really love this add in...
Can someone point me to some instructions on how to begin using the downloaded zip file corresponding to the excel 2007 version? I'm not sure how to use the xml files in excel as an add-in. Thanks!
Fabrice:
possible is my mistake, but...
when I try to copy with CTRL+C (for another excel sheet for example) and use the CTRL+V to paste, instead to have the data that I copied I receive an icon of the Sparkline Add-In.
The same behavior with Paste Special.
It will be great if you could give me a feedback about this.
Best Regards
IMZ
Igor, you are right.
I will have look at this strange behavior and come back to you ASAP...
Saludos
Igor
a corrected version has been posted, thanks for telling me if if behaves correctly.
Saludos
Igor,
see the post :
Release 3.2.3 for Excel 2003
This will lead you to the last version.
NIce stuff I have modified a little and would love to see peoples variations on the sparklines caper, particularly bullet charts.
I am having some trouble with sharing files though, has anyone had similar?
If I pass my file to a co worker who has installed the add in,all the formulae fail to work and checking them , cell formula chaged to say..
='C:\Documents and Settings\myusername\ApplicationData\Microsoft\AddIns\Sparklines_3.2.2.RNO.xla'!linechart('PI Data2'!I11:I299,,0,150,G13/24)
Deleting the unnecessary specific user reference fixes the problem, then when he closes the file and I re open on my machine, the formaula now all say...
='C:\Documents and Settings\OTHERUSERNAME\ApplicationData\Microsoft\AddIns\Sparklines_3.2.2.RNO.xla'!linechart('PI Data2'!I11:I299,,0,150,G13/24)
any clues how I can stop this very specific referencing?
I have tried variations on the installation theme including leaving the add in on the network etc. no luck. help appreciated!
Fabrice, I don't know if you already have this somewhere, but for people who work offline a lot, do you have a pdf or other downloadable instruction book for the charts. You used to have all of the charts tutorials in the spreadsheet but now they're gone.
Thanks,
matt
Matt: There's a pdf here:
http://downloads.sourceforge.net/sparklinesforxl/Sparklines3.2_manual.pdf?modtime=1224672584&big_mirror=0
That manual is in need of an update however since we added some new functionality in the latest releases.
Post a Comment